

/genie-hub/insights). The page opens on the Conversational Insights tab, and a row of tabs at the top lets you switch between four views:
- Conversational Insights — the story across all your conversations, with wins, trends, and prompts you can ask about them.
- Per-call Analysis — the full drill-down list of every individual call, with topics, lead details, and export.
- Analytics — headline numbers, a conversation timeline, and a per-Genie performance leaderboard.
- Activity — an audit trail of changes to your Genies, knowledge, and settings, plus what needs your attention.
The Analytics and Activity views live inside this hub as tabs. Old bookmarks to
/genie-hub/analytics or /genie-hub/activity still work — they open the Insights hub on the matching tab automatically.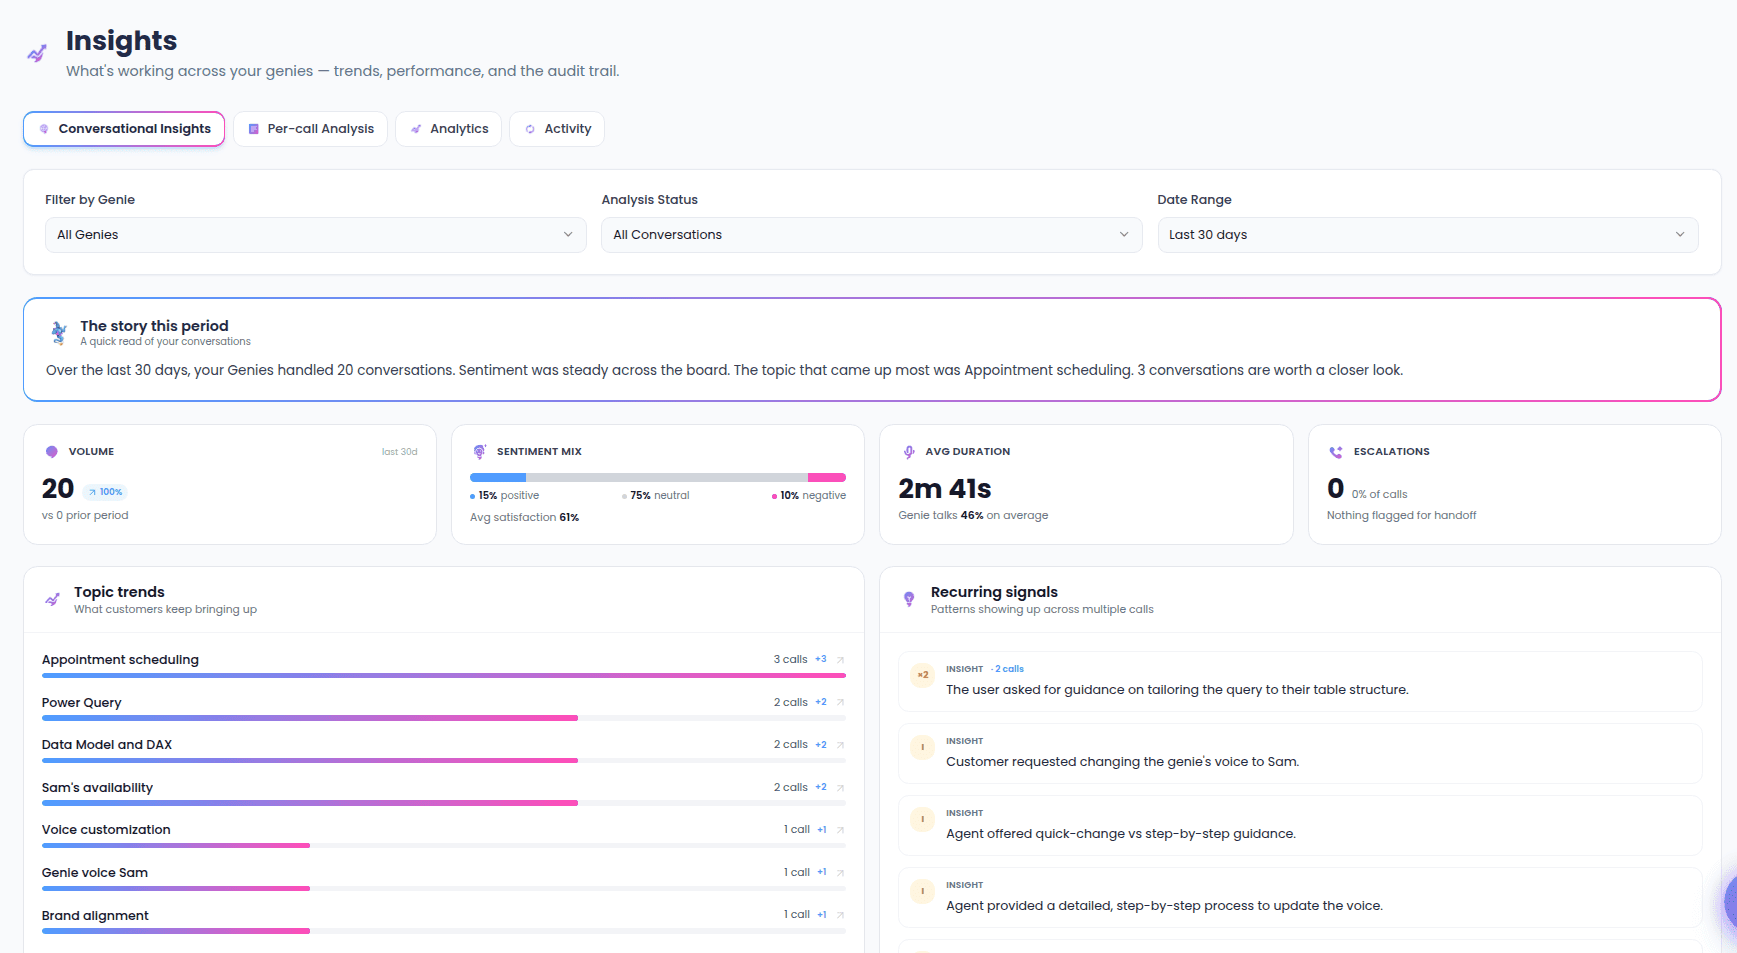
Conversational Insights
This is the default tab: a briefing on everything your Genies have handled over a chosen period. Rather than a raw list, it reads your conversations and tells you the story.Filters
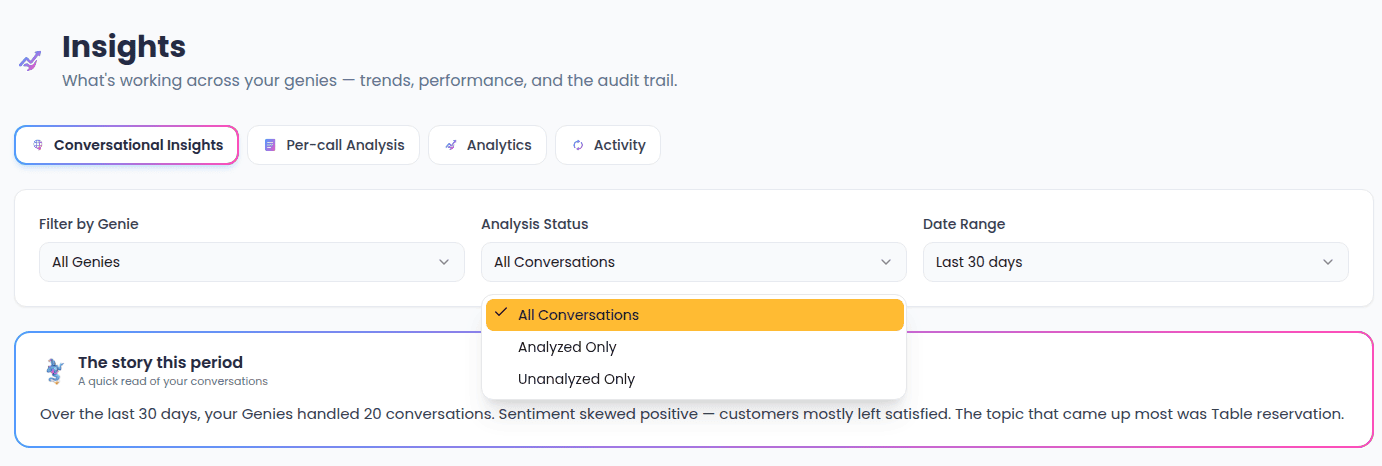
Three filters at the top shape everything below them:- Filter by Genie — focus on a single Genie or leave it on All Genies. Genies shared with you by your team are marked Team.
- Analysis Status — show all conversations, only those that have been analyzed, or only those still waiting for analysis.
- Date Range — last 7 days, last 30 days (the default), last 90 days, or all time.
The story this period
At the top, a highlighted card gives you a short, plain-English read of the period — how many conversations came in, whether sentiment leaned positive or negative, the topic that came up most, and how many calls are worth a closer look. When a richer Smart summary is available it’s used; otherwise a quick summary is generated from your conversations.The pulse strip
Four at-a-glance cards sit beneath the story:- Volume — how many conversations came in this period, with an up/down comparison against the previous period.
- Sentiment mix — the split between positive, neutral, and negative conversations, plus an average satisfaction score when available.
- Avg duration — the typical call length, and roughly how much of the time your Genie was talking.
- Escalations — how many calls were handed off to a human, and what share of total calls that represents.
What stood out, trends, and signals
When a Smart digest is available, a What stood out section surfaces decision-shaped highlights — labelled Win, Opportunity, Theme, or Worth a look — each with a short explanation and links to example calls. Below that:- Topic trends — what customers keep bringing up, with newly-appearing topics flagged as new. Select any topic to ask your Genie about it in more depth.
- Recurring signals — patterns and recommendations your Genies flagged across multiple calls. Select one to dig into it.
- Action queue — the conversations worth reviewing first, sorted by urgency and tagged with why they’re flagged (negative sentiment, an escalation, a missing lead, or analysis not yet run). Select a row to open the full conversation.
Ask Your Genie
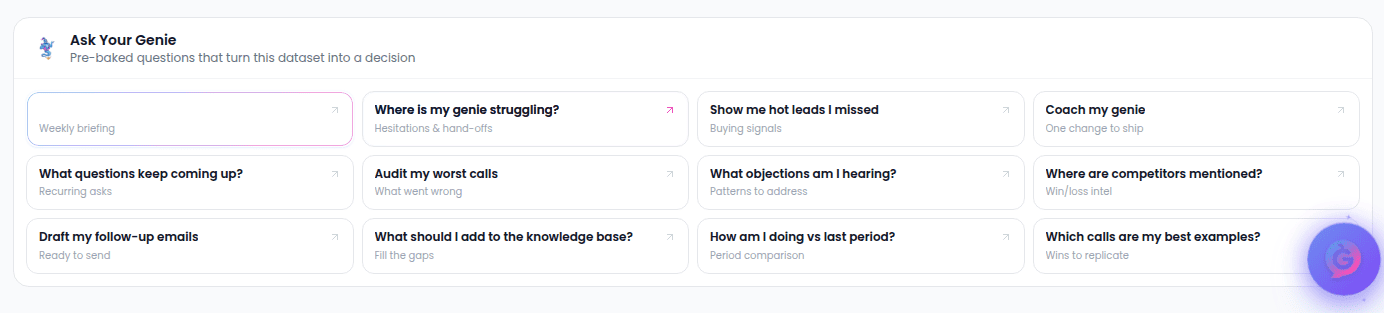
Two ways to turn this data into answers:- Ask Your Genie button — opens a chat pre-filled with a summary of your current filters, so your Genie can give you a Smart breakdown of the period. Selecting a topic, signal, or suggested prompt does the same thing with a more specific question.
- Suggested questions — a grid of ready-made prompts near the bottom, such as “Where is my genie struggling?”, “Show me hot leads I missed”, “Coach my genie”, and “Draft my follow-up emails.” Select one to send it straight to chat, already scoped to your selected Genie and date range.
Once people start talking to your Genies, this is where the story lands. If there’s nothing here yet, share your Genie’s link or QR code to get the first conversations flowing.
Per-call Analysis
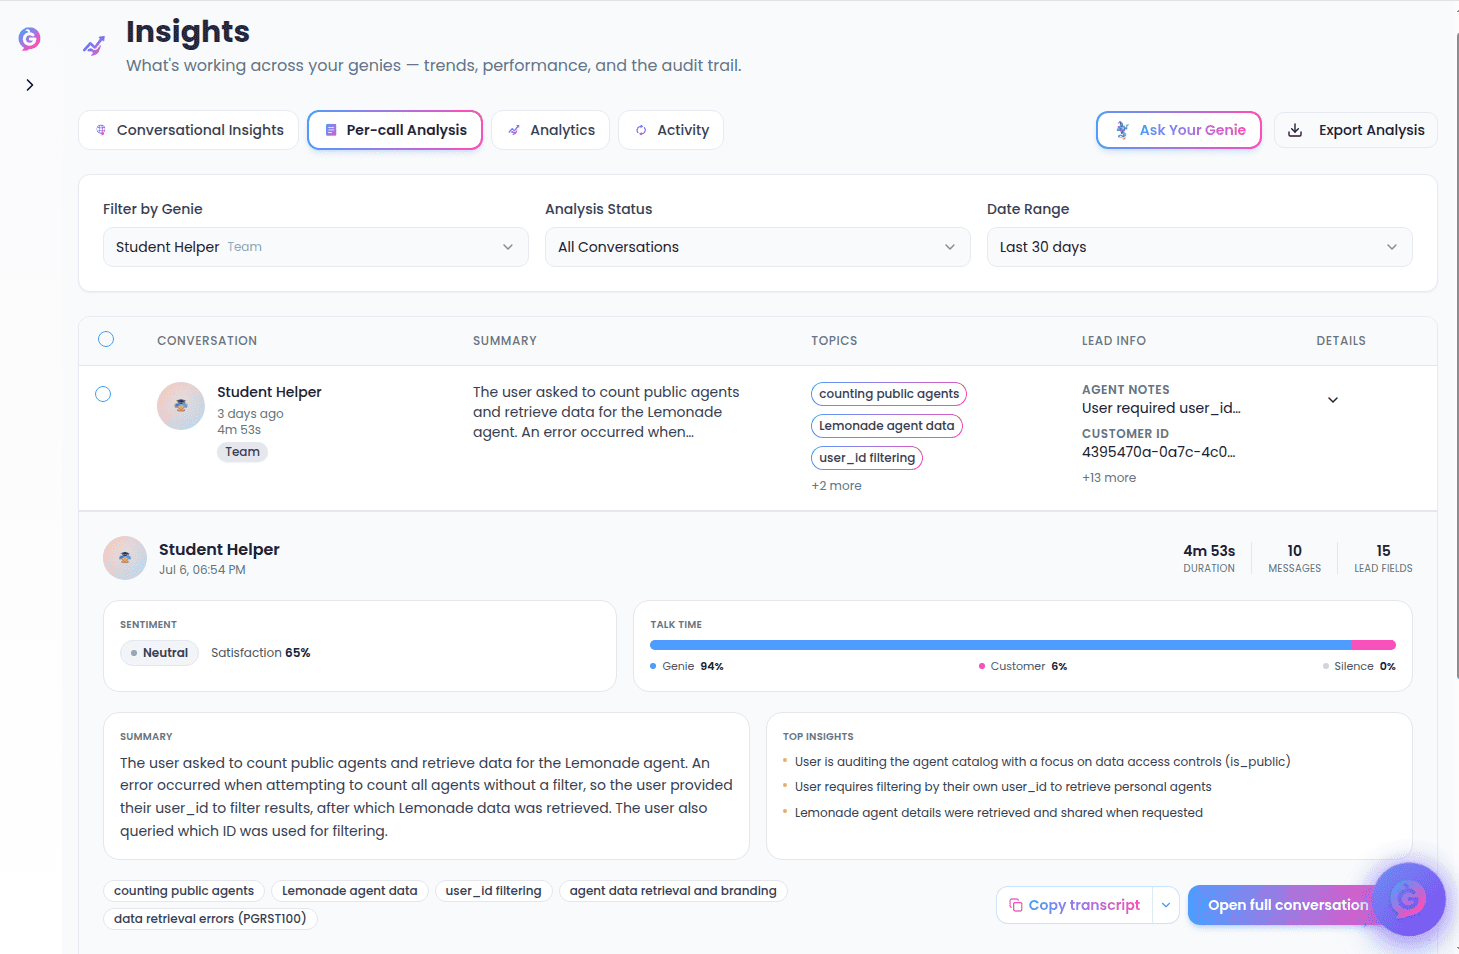
The Per-call Analysis tab is the detailed drill-down: every individual conversation, listed newest first, using the same Genie / Analysis Status / Date Range filters as the Insights tab.What each row shows
Every conversation shows the Genie that handled it, the date and duration, a short summary, its topics, and any lead information captured (name, contact details, and other fields your Genie collected). Conversations handled by a team member’s Genie are marked Team.- Expand a conversation — open a row to see its full analysis: overall sentiment and satisfaction, a talk-time breakdown (how much the Genie, the customer, and silence each took), a summary, top insights, and all its topics. From the expanded view you can copy the transcript or Open full conversation.
- Run analysis — if a conversation hasn’t been analyzed yet, a play button lets you analyze it on the spot to fill in its summary, topics, and lead details.
Selecting, asking, and exporting
- Select conversations — tick individual rows, or use the header checkbox to select everything currently visible. A bar appears at the bottom of the screen showing how many you’ve selected.
- Ask Your Genie about a selection — from that bar, send just the selected conversations to chat to compare, summarize, or pull insights from them.
- Export a selection — download the selected conversations as an Excel spreadsheet.
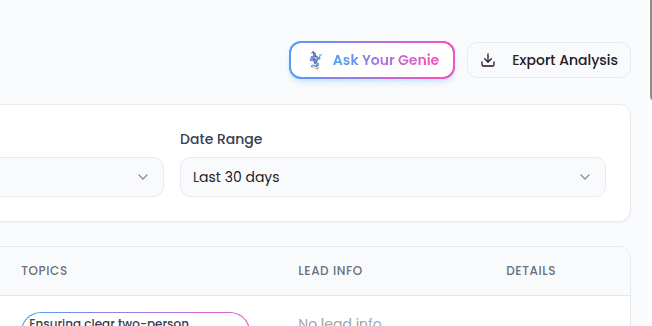
- Export Analysis — export every conversation for the current filters at once. This requires a single Genie to be selected first; until you pick one, the button stays disabled with a “Filter by a Genie first” hint.
Analytics
The Analytics tab is the numbers view — headline stats, a timeline you can plot per Genie, and a performance leaderboard.Overview
Four cards summarize your whole account:- Total Conversations — across all your Genies.
- Active Genies — how many Genies you have.
- Avg. Conversations/Genie — the average spread of conversations across them.
- Top Performing Genie — the Genie with the most conversations.
Conversation Timeline
A chart plots conversation volume over time. Use the date range control to switch between the last 7, 30, or 90 days. By default, every Genie that has had conversations is plotted; you choose which Genies appear by selecting them in the performance list below.Genie Performance
A ranked list of your Genies, ordered by how many conversations each has handled. Each entry shows the Genie’s avatar and name, who owns it, its brand, its Total Conversations, and its activity in the Last 7 Days. Genies shared by teammates are marked Team.- Select a Genie — tick a Genie (or select its card) to add it to the timeline chart above. A count shows how many Genies are currently plotted.
- Select All Active / Deselect All — add or remove every Genie that has conversations from the timeline in one click. Genies with no conversations are left out.
Activity
The Activity tab is the audit trail — what your Genies did, what changed in your account, and what needs a closer look. It focuses on meaningful events (edits to Genies, knowledge, and settings) rather than routine clicks.This week’s digest
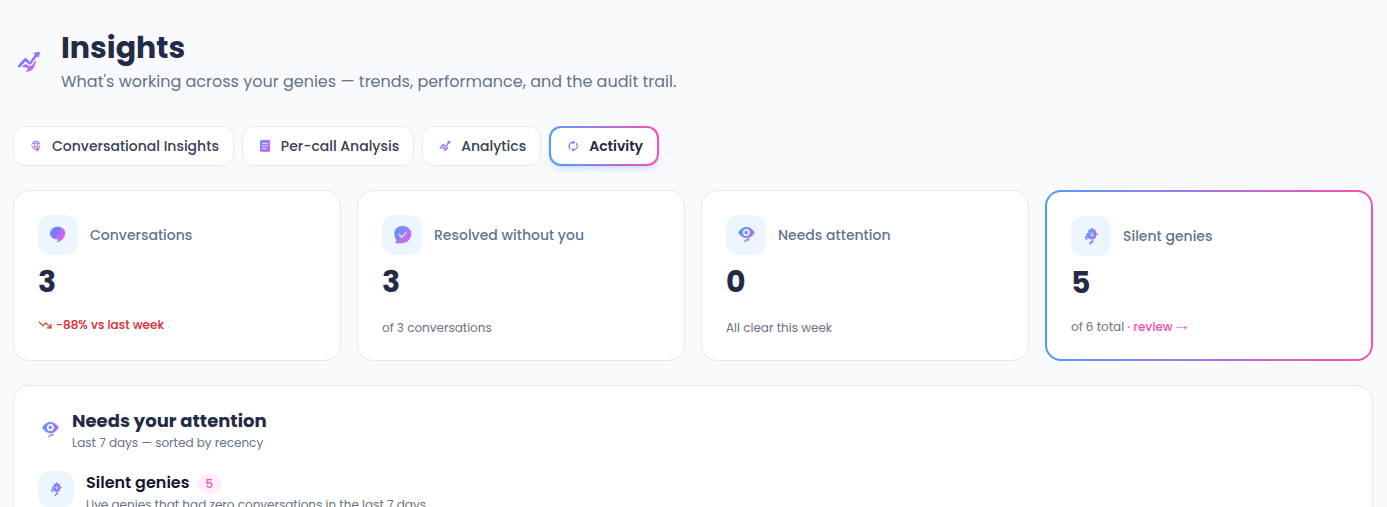
Four tiles at the top summarize the last 7 days:- Conversations — how many came in, compared with the previous week.
- Resolved without you — how many of those conversations your Genies handled start-to-finish, with no handoff to your team.
- Needs attention — how many items are flagged for review; select this tile to jump straight to them.
- Silent Genies — how many live Genies had no conversations, out of your total.
Needs your attention
A dedicated panel groups anything from the last 7 days worth reviewing, sorted by recency:- Escalations — calls your Genies handed off to a human.
- Low sentiment — conversations that left callers frustrated, with a sentiment score.
- Negative feedback — direct thumbs-down left by end users.
- Silent Genies — live Genies with zero conversations in the last week.
Recent changes
A running feed of meaningful events — edits to Genies, knowledge documents, account settings, and more. Each entry shows what happened, which Genie or resource it affected, when it occurred, and its category. Items that failed or are high priority are marked with a colored dot, and you can select an entry to open the affected Genie, conversation, or document. You can shape the feed with:- Search — find activity by keyword.
- Date Range — Today, Yesterday, Last 7 days (the default), Last 30 days, or a custom start/end range.
- Category — filter to one or more types, such as Conversation Analysis, User Management, genie, document, account, security, or settings. Active categories appear as removable chips, and Clear filters resets everything.
- Show routine actions — off by default. Routine events like page views and your own edits are hidden to keep the feed meaningful; turn this on to see everything.